Underfunding dashboard available for members

Underfunding dashboard available for members, public to see the funding needs of schools in certain areas
Education Minnesota has used the term “full funding” as it relates to what our schools need and the union often gets asked, “what does full funding mean?”
Fully funded schools mean fully prepared students. A fully funded school is a place where all students and educators—no matter what they look like or where they come from—have what they need to be successful in their teaching and learning. This looks different in every place, but how we get there is the same. We need lawmakers to put students first and provide our schools with the sustainable, equitable and sufficient funding our children deserve.
To help with the funding conversation, Education Minnesota has developed a dashboard to show three areas where our districts need resources. Education Minnesota knows this does not show everything and we recognize the data is only as good as the data we are able to get from the state and other sources.
The dashboard looks at:
- Equity measures: What investment is needed to adequately support racial equity, special education students and English learners?
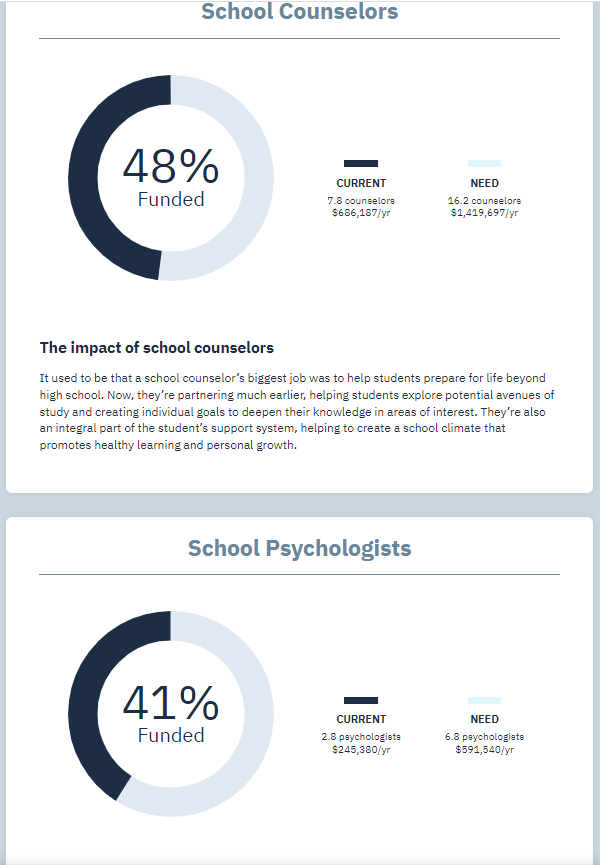
- Staffing: How much investment does a district need to ensure that students have access to licensed counselors, nurses, social workers and psychologists?
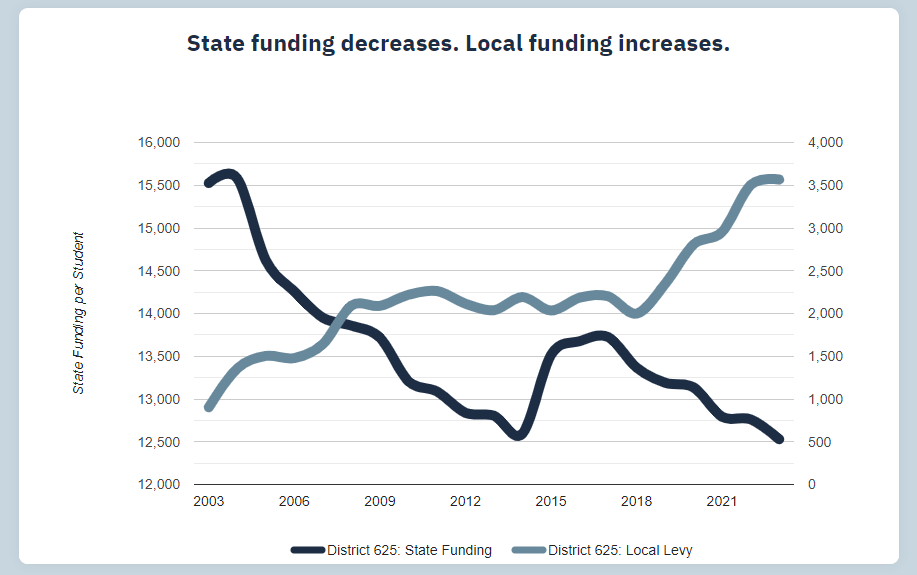
- The impact of inflation: How much spending power has a district lost over time and how much have our local communities been asked to raise in local tax dollars to keep operating their schools?
The areas highlighted on the dashboard are ONLY a few areas Minnesota must address to start the long process of building fully funded schools worthy of all students, regardless of race or address.
The data points are a snapshot of a few critical areas. What we do know is every school district in Minnesota is both underfunded and understaffed in some way.
Go to dashboard.believeinwemn.com to see your district’s data!
How do I use it?
Once on the page, you will enter in the school district number or city that you want to view. Then you will go through three values-based questions to demonstrate why these data points are important to student success.
The questions are:
- Should the state of Minnesota provide financial resources to close the racial equity opportunity gap and to fully fund special education services and instruction for English language learners?
- Should schools provide the nurses, counselors, psychologists and social workers that our students need to get timely help?
- Should school funding in Minnesota be equitable and sufficient across the whole state, so that all students—no matter what they look like or where they come from—have what they need to succeed?
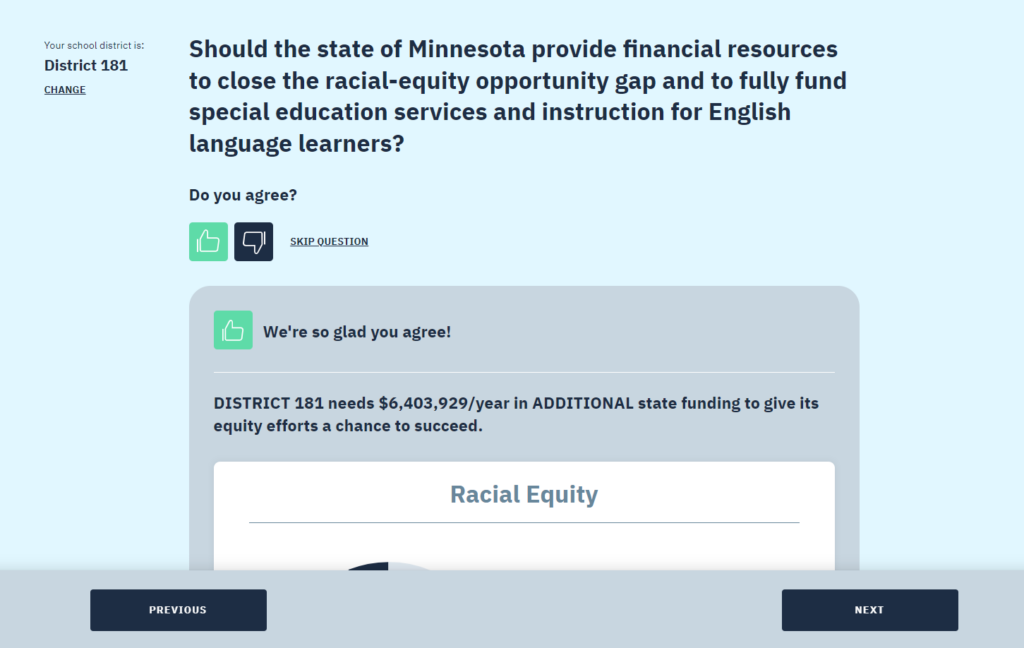
Users will be asked “Do you agree?” and click either a thumbs up or thumbs down icon. No matter which icon they choose, the same data will show up with either a “We’re so glad you agree!” or “We respect your position. Did you know…” message.
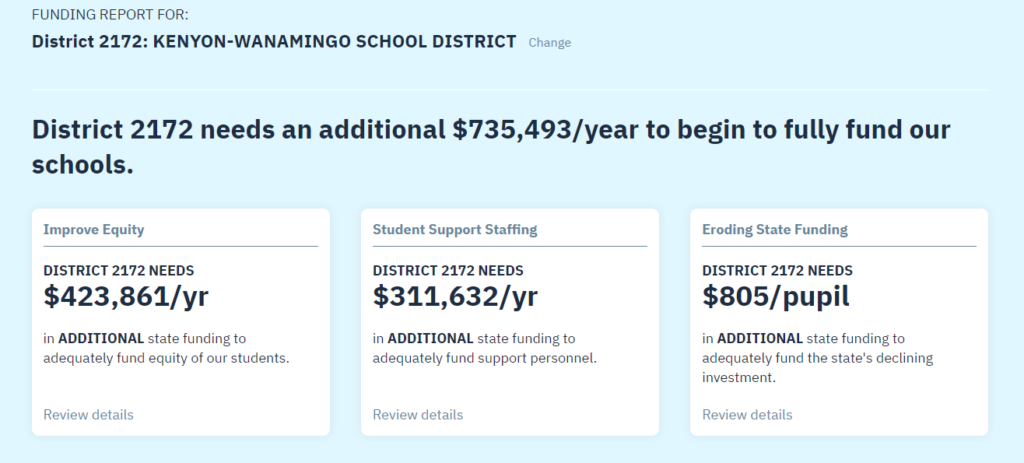
Then users will see how much funding their district needs in that category to meet the suggested threshold, either to have their categories fully funded like SPED or to meet the national ratios like support services staff or a graph showing how much local levies have had to cover costs. Users will also see an interactive graph showing at what level their district is currently funded.
Each category also includes a description of why these areas of funding are important to creating an equitable and successful school community.
At the end, the user will get a final “report” card summary of the total dollar amounts needed to fully fund each issue, as well as an opportunity to review the specific details.
Users will also have an opportunity to take action, including emailing their legislators to ask them to fully fund public education and sharing out the dashboard on their social media channels.
Why are there only a few areas shown?
There are the data points that Education Minnesota and the state can track for the 300-plus regular school districts and charter schools. Education Minnesota wanted to be sure that the issues were accessible statewide. Unfortunately, we are not able to represent the data from intermediate districts, coops and ed districts because of their limitations around levying for funding and some of their specific funding categories.
These are also the data points where we can show a direct dollar amount to resolve the underfunding. While we know class size is an important issue for parents, that is difficult to quantify as a firm number at the district level, as it may be one data point in elementary schools and one in middle and high schools and hard to summarize as a total.
These are also data points that we know most Minnesotans can wrap their minds around being important for schools. Each issue includes a summary statement as to why and how underfunding in the area affects students and staff.
Education Minnesota makes sure to reference on the beginning and ending pages that this does not tell a complete story of the lack of funding in our schools, but these are important areas to highlight as a part of the puzzle.
How did we get/calculate this data?
This data is from both internal and external sources:
For Question One on the racial equity opportunity gap and fully funding special education services and instruction for English language learners: This data comes from the Minnesota Department of Education. It was generated in response to proposals from the State Funding Task Force around racial equity.
Special education and EL data is MDE data on the cross-subsidies that represent underfunding of supports for special education students and multilingual students. This data compares actual spending vs. dedicated revenue for students who participate in special education and English learner programming. These are amounts directly provided and calculated by MDE.
For Question Two on the staffing of nurses, counselors, psychologists and social workers: This data is calculated by Education Minnesota. MDE data is used on the numbers of staff in each district in each position and calculate the ratio of students to nurses (for example). The FTE needed for districts to have sufficient staff to meet the ratios recommended by the professional associations (the National Association of School Nurses, for example) is calculated. And then the dashboard shows the funding gap. We then determine a total cost associated with the gap by multiplying the number of staff needed by a per-FTE cost number that we generate by looking at the average salary reported for licensed teachers with an additional 30% benefit premium. For Question Three on the funding levels and inflation adjustments: This data is based on MDE and the calculations are done by an economist with expertise in school finance, Jeff VanWychen, a consultant with Northstar Policy Action. The data takes MDE’s per-pupil aid and levy amounts from the most recent forecast and does an inflation-adjustment to determine their value in 2003 dollars. The trend is shown in per-pupil amounts (which we talk about as the per-pupil spending power).